
By SYNENTEC
In a recent publication in Cancers, Hedemann et al. impressively demonstrate the usefulness of NYONE® Scientific to image and analyse the combined effects of a small-molecule inhibitor and chemotherapy in a cancer spheroid model. Here, we summarise how our imager and YT®-Software helped in their study.
1. Characterisation of Spheroids
- Non-invasive brightfield imaging was used to analyse spheroid growth over time
- Application: Spheroid Quantification
- Software Features: Spheroid Area, Spheroid Diameter, Time Charts, Galleries show growth of each spheroid over time
- Imaging of a live/dead assay helped to evaluate spheroid features like compactness or necrotic core formation (Fig. 1)
- Application: Spheroid Quantification 2F
- Software Features: Spheroid Area, Spheroid Diameter, Average Fluorescence Intensity of each spheroid
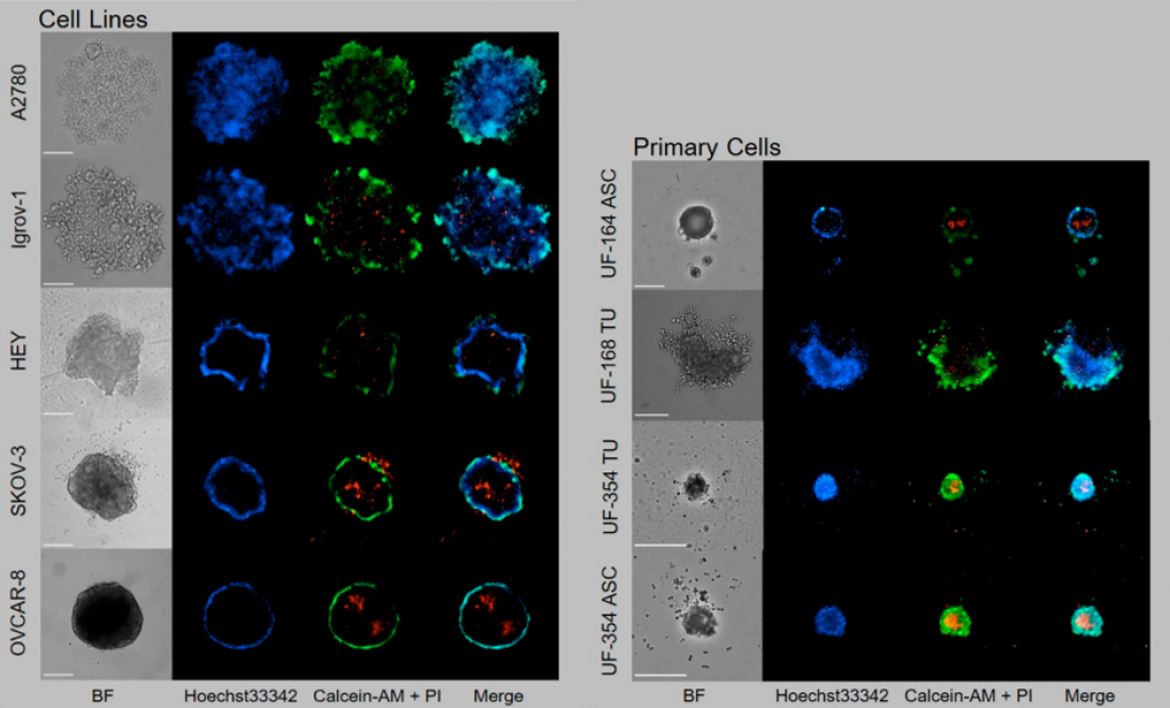
Figure 1: Cell lines and primary cells from tumor tissue (UF-168 TU and UF-354 TU) or ascites (UF-164 ASC and UF-354 ASC) were seeded in ULA plates and grown for six days for spheroid formation. Staining with calcein-AM (living cells, green), propidium iodide (dead cells, red) and Hoechst33342 (nuclei, blue). Scale = 250 µm; objective 10×. Modified from: Hedemann et al., Cancers 2021, 13(9), 2039; https://doi.org/10.3390/cancers13092039.
2. Analysis of Combined Drug Effects
- Non-invasive imaging allows kinetic imaging over time and multiplexing with endpoint assays in one plate (Fig. 2)
- Imaging of CellToxTM Green was used to analyze the combined drug effects
- Application: Spheroid Quantification 1F
- Software Features: Spheroid Area, Spheroid Diameter, Average Fluorescence Intensity of each spheroid
- Data can be easily exported and used to calculate dose response curves and IC/EC50 values (Fig. 3)
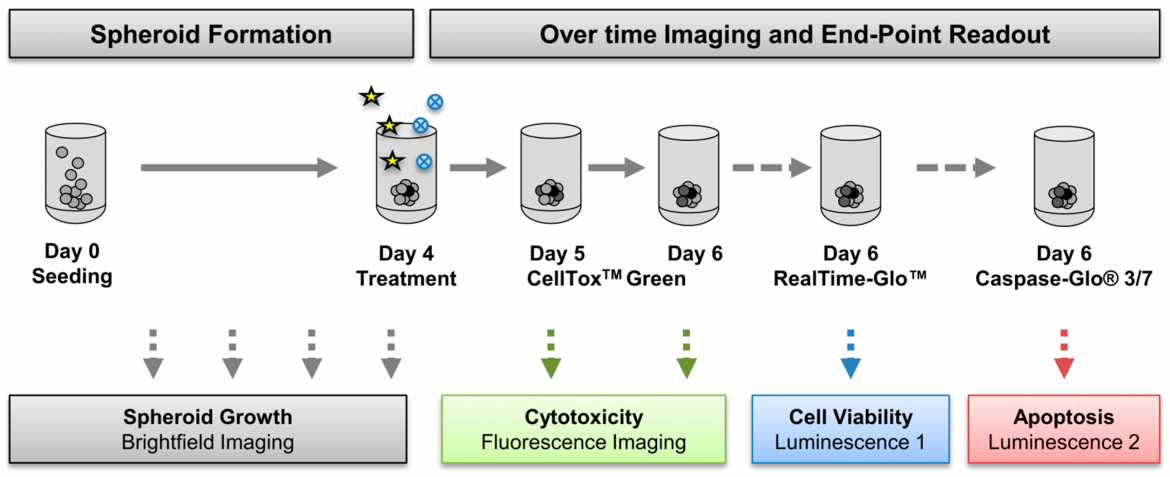
Figure 2: Cancer cells were seeded in ultra-low attachment (ULA) plates and spheroid formation was monitored daily using NYONE® Scientific (SYNENTEC). On day four, spheroids were treated with a chemotherapeutic drug (asterisks) in absence or presence of small-molecule inhibitors (blue circles). The real-time fluorescence-based cytotoxicity assay CellTox Green was applied on day five and imaged on the same and the next day. From: Hedemann et al., Cancers 2021, 13(9), 2039; https://doi.org/10.3390/cancers13092039.
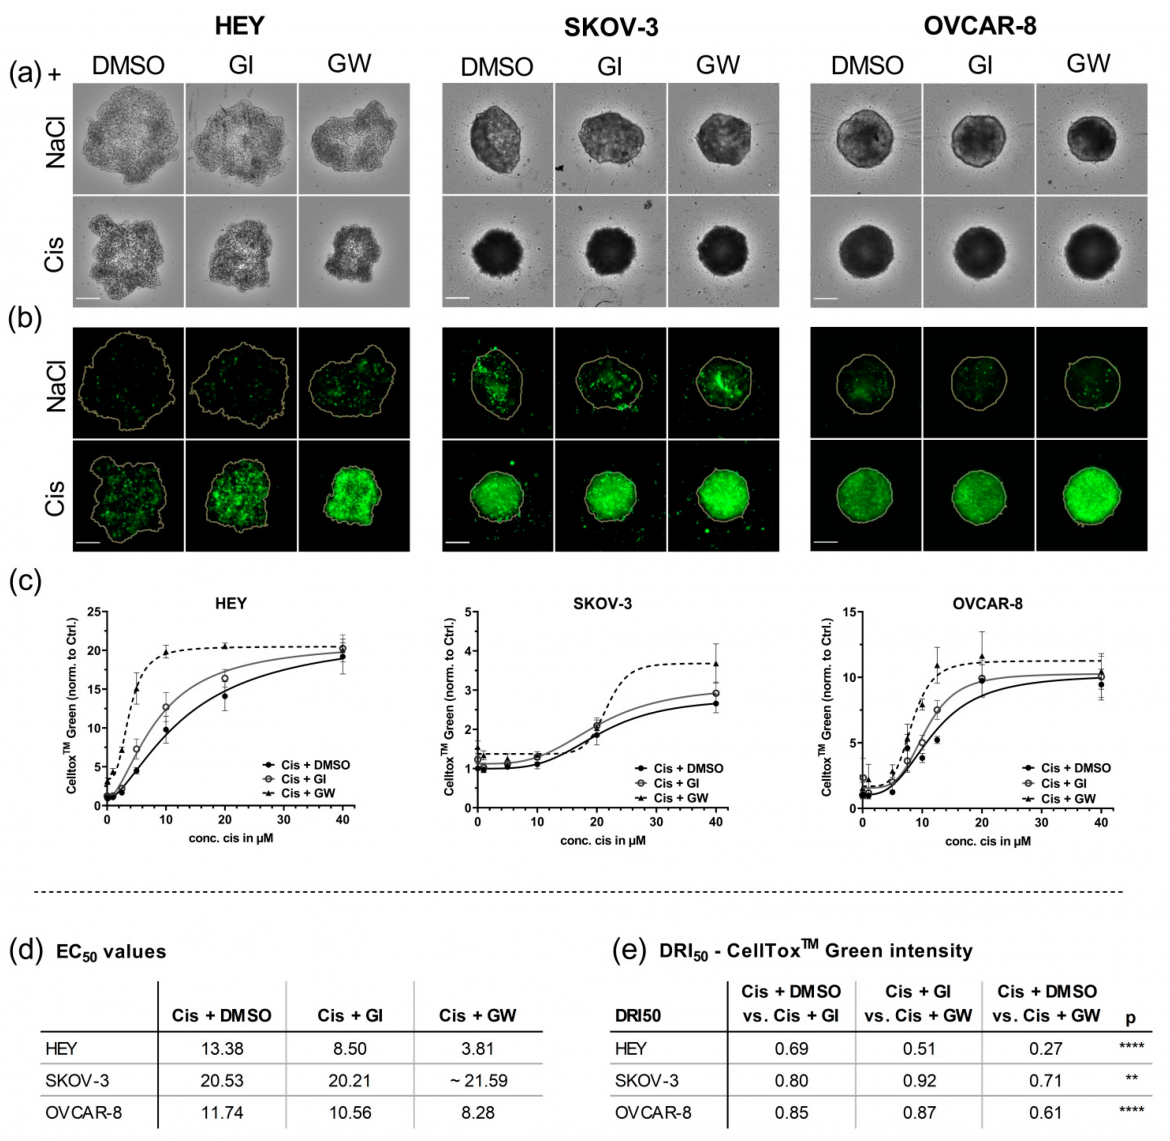
Figure 3: Different cell lines were cultured for 4 days in ULA plates for formation of spheroids and treated with the indicated concentrations of cisplatin (Cis) and NaCl. ADAM17 activity was inhibited using GW280264X (GW) and ADAM10 by GI254023X (GI). DMSO was used as a solvent control. At 48 h after treatment, the spheroids were imaged using NYONE® Scientific. (a) Representative brightfield (BF) images 48 h after treatment. (b) Corresponding CellToxTM Green (CTG) images. Orange line indicates the spheroid area as determined in the BF image by the spheroid quantification (1F) application of YT®-Software. Objective: 4×, Scale: 250 µm. (c) Normalized CTG intensities of at least three biological replicates demonstrate the combined effect of GW280264X and cisplatin. (d) EC50 values of CTG; (e) drug reduction index (DRI50) at 50% effectiveness. Synergistic effect (DRI50 < 1), additive effect (DRI50 = 1), and antagonistic effect (DRI50 > 1). ** p < 0.01, **** p < 0.0001. From: Hedemann et al., Cancers 2021, 13(9), 2039; https://doi.org/10.3390/cancers13092039.
In summary, this publication highlights the suitability of automated high-throughput imaging for drug discovery in 3D models.